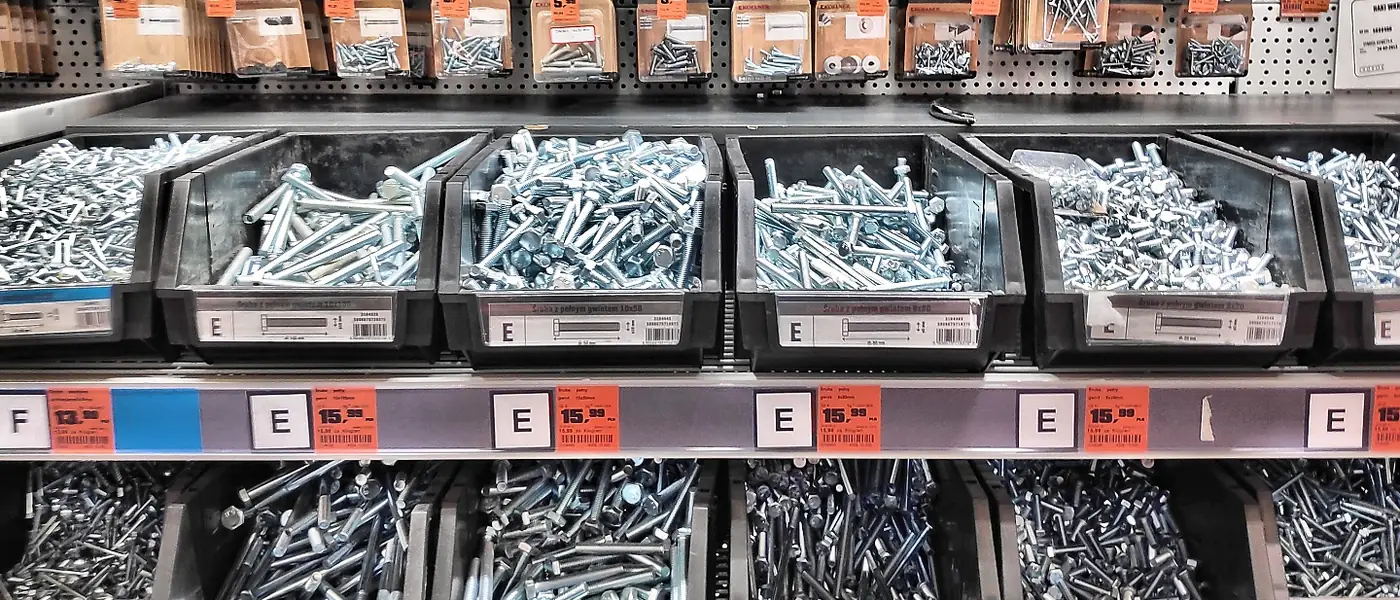
Not every item deserves the same attention. A store with 5,000 items cannot count, reorder and price them all with equal care. Two standard classifications tell you where to focus.
ABC analysis: by value
Rank items by annual sales value (quantity sold × price), highest first, and add up the running share of total sales.
| Class | Typical share of items | Typical share of sales value | Treatment |
|---|---|---|---|
| A | A small share of items | Most of the sales value | Never run out; count often; negotiate supply |
| B | A middle group | A moderate share | Regular review |
| C | Most of the items | A small share of value | Simple rules; bulk reorder |
The exact cut-offs are yours to set; a common starting point is the items making up the first 70–80% of value as A.
FSN analysis: by movement
Classify items by how recently and how often they sell:
- Fast-moving: sells every week.
- Slow-moving: sells occasionally, e.g. a few times a quarter.
- Non-moving: no sale in six months or more. This is dead stock.
Put them together
| Fast | Slow | Non-moving | |
|---|---|---|---|
| A (high value) | Top priority: stock reliably, reorder point | Watch closely; order smaller lots | Clear urgently: cash is trapped |
| C (low value) | Keep plenty; bulk buy | Minimal stock | Clear or return |
Reducing dead stock
- List it. Anything unsold for six months, with its purchase value.
- Return or exchange. Ask the distributor; many accept returns of saleable stock, especially against new orders.
- Bundle it. Pair slow items with fast sellers in contractor packs.
- Discount deliberately. A planned discount recovers cash that otherwise stays on the shelf.
- Stop the cause. Most dead stock comes from buying on a scheme or a one-off request. Order special items against the customer's advance.
Find your fast movers without software
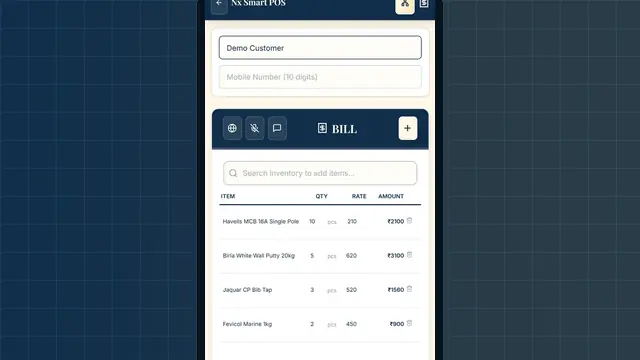
Take last month's bills, count how many bills each item appears in, and sort. The top of that list is your fast-moving A and C stock. NANDIX OS produces this from sales automatically, alongside stock levels.